Parking performance benchmarking — comparing a facility’s operational metrics against industry standards and peer facilities — provides the external context that internal metrics alone cannot. A facility that achieves 80 percent peak occupancy might consider itself well-managed until benchmarking reveals that comparable facilities in similar markets achieve 90 to 92 percent. Without benchmarking, operators optimize against their own history rather than against what is actually achievable in their market.
Why Benchmarking Matters
Internal performance tracking (revenue vs. prior year, occupancy vs. budget) measures improvement relative to the facility’s own baseline. This is valuable but incomplete. Benchmarking asks a fundamentally different question: how does this facility perform relative to comparable facilities?
A facility that improves revenue 5 percent year-over-year might conclude it is performing well — until benchmarking reveals that the broader market grew 12 percent during the same period, suggesting the facility is actually losing competitive position despite absolute improvement.
Benchmarking also identifies performance gaps that self-improvement metrics don’t reveal. If the facility’s operating expense per stall is 30 percent above benchmark for comparable facilities, that gap points to a specific operational efficiency investigation. Without the benchmark, the elevated cost may be accepted as simply “the cost of this facility.”
Primary Benchmarking Sources
IPMI Parking Benchmarks Report: The most comprehensive industry benchmarking source for North American parking, published annually by the International Parking and Mobility Institute. The report provides benchmarks across revenue, occupancy, operating cost, staffing, and customer satisfaction metrics, segmented by:
- Facility type: surface lot, above-grade structure, underground structure, mixed-use structure
- Market type: CBD/urban, suburban, medical, institutional, airport
- Ownership/management model: owner-operated, managed, leased
- Facility size (stall count)
IPMI members receive the report as a membership benefit; non-members can purchase it. The report is the first reference point for any parking benchmarking exercise.
NPA (National Parking Association): Supplements IPMI data with membership-based surveys and periodic industry reports. NPA’s data is particularly useful for specialty segments (events, valet, residential).
Management company proprietary benchmarks: Large parking management companies maintain internal benchmarking databases from their managed portfolio. Operators within these networks can access peer comparisons not available from published sources. This represents a meaningful advantage for managed facilities within a portfolio.
CBRE and JLL parking market reports: Commercial real estate firms publish periodic parking market reports for major urban markets, providing rate, revenue, and demand trend data useful for competitive benchmarking.
Performance Metrics to Benchmark
A complete benchmarking analysis covers four metric categories:
Revenue metrics:
- Revenue per stall per year (IPMI benchmark varies widely by market; CBD structures typically $2,500 to $8,000+ per stall/year)
- Revenue per occupied stall-hour (REVPOS)
- Monthly parker revenue as percentage of total revenue
- Effective hourly rate vs. posted rate (discount penetration)
Occupancy metrics:
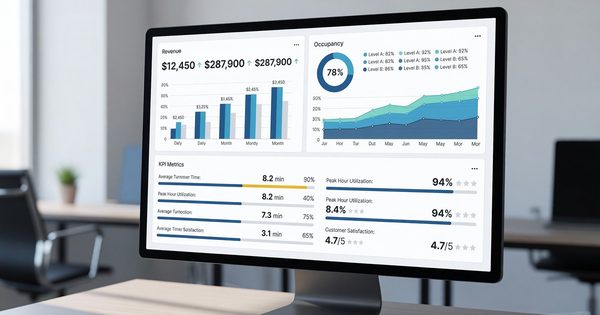
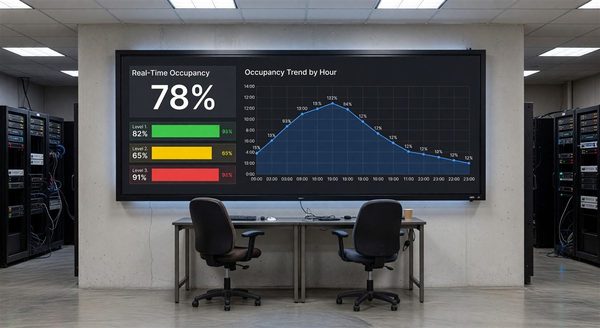
- Peak weekday occupancy percentage
- Average weekday occupancy
- Weekend occupancy vs. weekday (the ratio reveals demand pattern)
- Annual occupancy rate (occupied stall-days ÷ total stall-days)
Operating cost metrics:
- Total operating expense per stall per year (IPMI benchmark: $800 to $2,500 depending on facility type and market)
- Labor cost as percentage of revenue (typically 30 to 50 percent for attended operations)
- Maintenance cost per stall per year
- Utility cost per stall per year
Customer experience metrics:
- Customer satisfaction score (benchmark: 85 to 90 percent satisfaction for well-managed attended facilities)
- Online review rating (benchmark: 4.0+ on Google for competitive commercial parking)
- Complaint volume per 1,000 transactions
Conducting a Benchmarking Analysis
Step 1: Select the right peer group. Benchmarking against the wrong peer group produces misleading results. A 200-stall suburban surface lot should not benchmark against a 2,000-stall urban structure. Use IPMI’s segmentation (facility type, market type, size) to select the most comparable benchmark group.
Step 2: Collect internal data. Pull the specific metrics listed above for the trailing 12 months from PARCS, financial statements, and customer satisfaction systems.
Step 3: Compare and identify gaps. For each metric, compare the facility’s performance to the median and top-quartile benchmark. Metrics below median are potential improvement opportunities; metrics below bottom-quartile require investigation.
Step 4: Root cause the gaps. Each performance gap should be traced to a specific operational, structural, or market cause:
- Revenue below benchmark: pricing below market? Mix of monthly vs. transient? Underutilized capacity?
- Operating cost above benchmark: labor overstaffing? Equipment maintenance inefficiency? Utility cost above market?
- Customer satisfaction below benchmark: equipment reliability? Staff quality? Facility condition?
Step 5: Prioritize improvements. Not all gaps are equally addressable. Prioritize based on financial impact, implementation feasibility, and time to improvement. A facility 30 percent below benchmark on revenue per stall needs a different improvement roadmap than one 10 percent below on customer satisfaction.
Benchmarking Traps to Avoid
Comparing incomparable facilities: A suburban hospital garage and a downtown commercial garage have fundamentally different demand patterns, customer types, and operating models. Benchmarking across fundamentally different facility types produces misleading conclusions.
Using benchmarks as targets without context: If the top quartile achieves 94 percent peak occupancy and the facility achieves 75 percent, the answer might not be “raise rates to fill to 94 percent” — it might be that the local market’s office occupancy is lower, or the facility serves a different customer mix. Benchmarks are diagnostic, not prescriptive.
Infrequent benchmarking: Annual benchmarking is the minimum. Markets change; operator performance changes; benchmarks shift. Facilities that benchmark annually and adjust their improvement priorities accordingly make faster progress than those that benchmark every 3 to 5 years.
Frequently Asked Questions
What is the IPMI Parking Benchmarks Report and how is it used? The IPMI Parking Benchmarks Report is an annual survey published by the International Parking and Mobility Institute that provides performance benchmarks for North American parking facilities across revenue, occupancy, cost, staffing, and customer satisfaction metrics. It is the primary benchmarking reference for the industry. Facilities use it to compare their specific metrics against the median and top-quartile performance of comparable facilities.
What are typical operating cost benchmarks for parking facilities? IPMI data shows total operating expense of $800 to $1,200 per stall per year for surface lots and $1,500 to $2,500 per stall per year for parking structures, varying significantly by market, staffing model, and facility age. Labor typically represents 30 to 50 percent of total operating expense.
How often should a parking facility conduct formal benchmarking? Annual benchmarking is the minimum standard. Quarterly comparison against published industry data (where available) and monthly tracking of internal metrics against the annual benchmark provides the most operationally responsive benchmarking framework.
What is the most actionable benchmarking gap to identify? Revenue per stall gaps (revenue significantly below benchmark for comparable facilities) typically have the highest financial impact and the most direct connection to actionable improvements — pricing adjustments, product mix changes, or marketing investment. Cost benchmarking gaps require more detailed operational analysis but often yield significant savings once root causes are identified.
Takeaway
Parking performance benchmarking converts the IPMI and other industry data from reference material into an operational management tool. Facilities that benchmark regularly against the right peer group, identify specific performance gaps, root cause those gaps to operational factors, and track improvement over time consistently outperform those that manage solely against their own historical baseline. The benchmarking discipline is not about achieving average performance — it is about understanding where the facility sits in the distribution of comparable facilities and making intentional decisions about whether to close gaps or accept them as reflections of facility-specific constraints.
Further Reading from Authoritative Sources
- IPMI Benchmarks Report — parking industry performance data — The International Parking and Mobility Institute is the source of the benchmarking data cited throughout the article.
- Transportation Research Board parking management performance research — The Transportation Research Board publishes independent research on parking facility performance measurement that provides the methodology context for the benchmarking approaches described in the article.