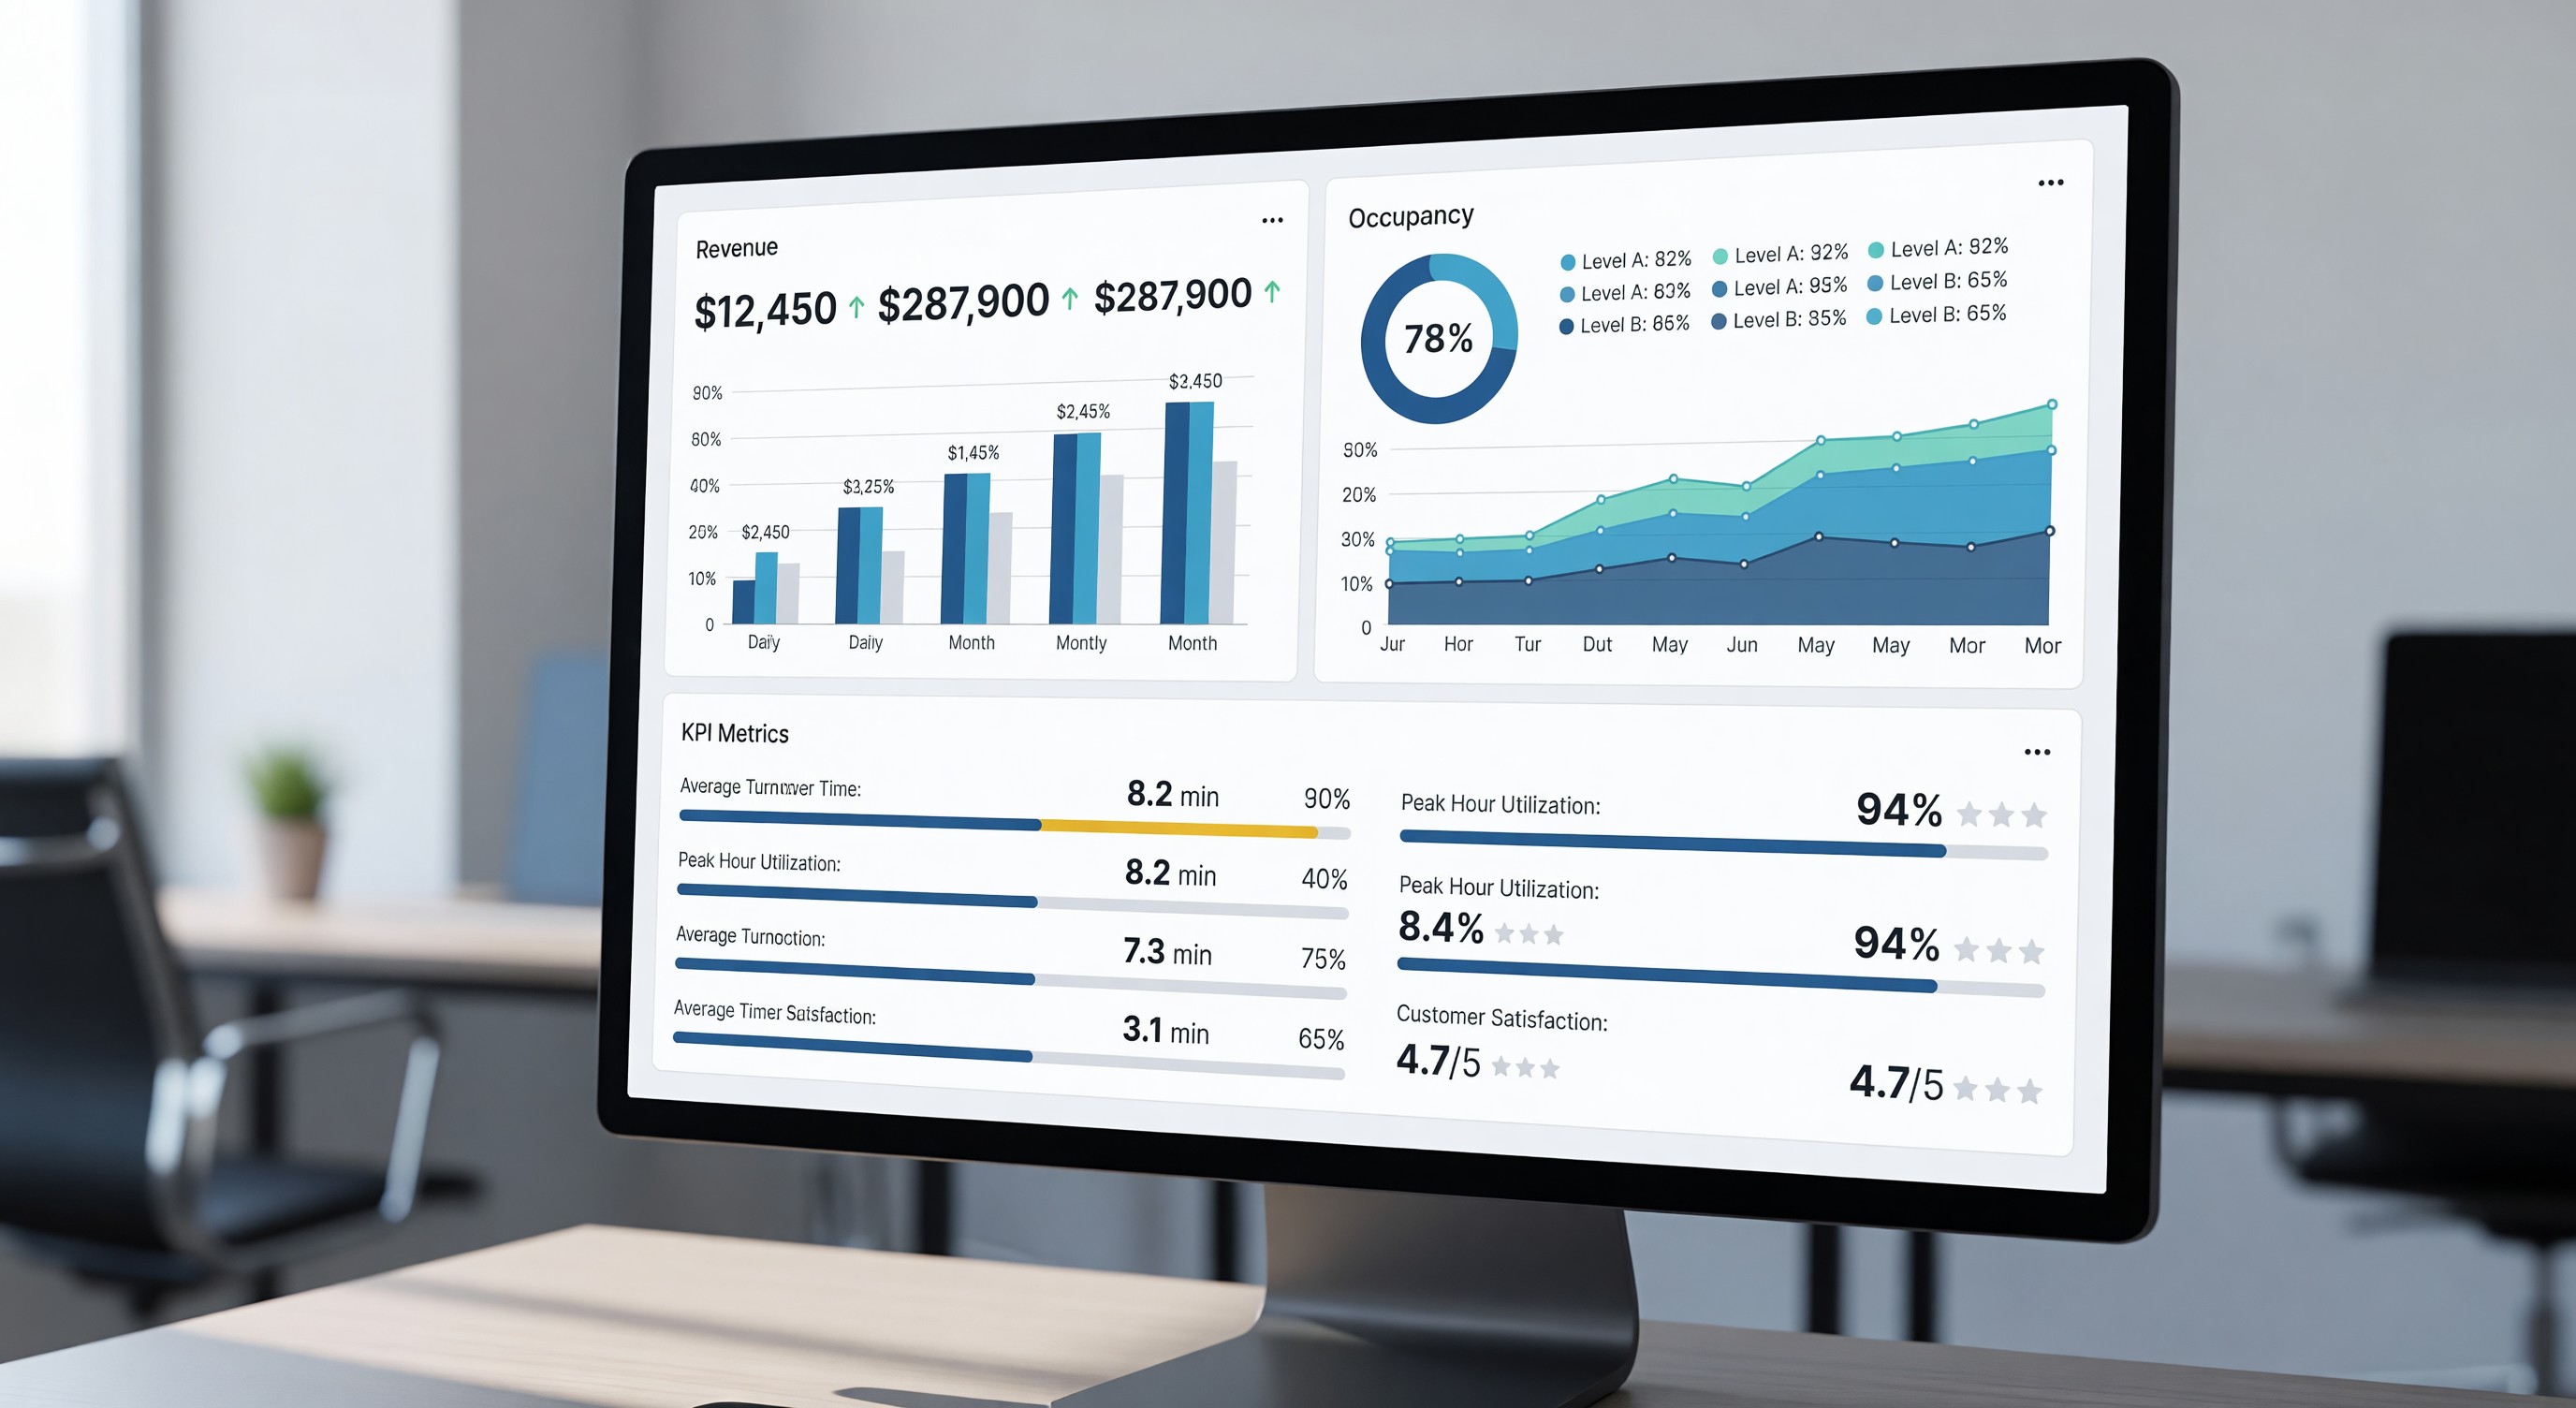
Parking operations generate data continuously — every transaction, every gate cycle, every payment event. The challenge is not finding data but deciding which metrics matter most, how to display them for operational decision-making, and how to interpret them against meaningful benchmarks. A well-designed KPI dashboard converts raw PARCS and financial data into actionable operational intelligence.
The Core KPI Framework
Effective parking KPI frameworks organize metrics into four categories: revenue, occupancy, operational efficiency, and customer experience. Each category supports a different management decision; the dashboard should make each category visible without forcing managers to choose between them.
Revenue KPIs:
- Total gross revenue: The foundational metric. Reported daily, weekly, and monthly, with year-over-year and budget comparisons.
- Revenue per occupied stall (REVPOS): Total revenue divided by the number of stall-hours used. More useful than raw revenue for comparing performance across facilities of different sizes. IPMI benchmark data provides peer comparison by facility type.
- Revenue by customer segment: Monthly parkers, transient daily, hourly, and event revenue reported separately. Segment mix shifts reveal structural changes (e.g., declining monthly as remote work increases) that raw revenue trends may obscure.
- Effective hourly rate: Total revenue divided by total paid stall-hours. Measures rate realization — the degree to which posted rates are being collected after discounts, validations, and fee structures.
Occupancy KPIs:
- Peak occupancy: The maximum stalls occupied at any point during the reporting period, expressed as a percentage of total inventory. Consistently above 95 percent signals demand that exceeds supply; consistently below 80 percent signals oversupply or under-marketing.
- Occupancy by day-part: Morning, midday, afternoon, and evening occupancy rates reveal demand patterns that daily averages mask. A facility that is 95 percent full from 9 a.m. to noon and 30 percent full from 1 p.m. to 5 p.m. has a very different revenue opportunity than one with 60 percent all-day occupancy.
- Turnover rate: Average number of vehicles per stall per operating period. Higher turnover indicates shorter average dwell times and higher transient fraction.
Operational Efficiency KPIs:
- Equipment uptime: Percentage of operational hours that each PARCS device (entry terminals, exit terminals, pay stations) is fully functional. Target 99 percent or better for primary lane equipment.
- Average transaction time: Mean time in seconds per vehicle at attended lanes. Benchmark targets vary by payment method: 25 to 35 seconds for attended cash/credit; 10 to 20 seconds for unattended pay station.
- Void/exception rate: Voids and manual exceptions as a percentage of total transactions. Above 1 to 2 percent warrants investigation.
- Revenue per labor hour: Total revenue divided by total labor hours worked. A proxy for labor efficiency; should be tracked monthly and compared to budget.
Customer Experience KPIs:
- Customer satisfaction score (CSAT): From survey or mystery shop programs. 85 to 90 percent satisfaction is a standard benchmark for attended facilities.
- Online review rating: Google and Yelp average rating; tracked monthly.
- Complaint volume: Total complaints per 1,000 transactions; categorized by type (billing, damage, equipment, staff).
Benchmarking Resources
KPIs without benchmarks are metrics without context. Key benchmarking resources:
IPMI Parking Benchmarks Report: Published annually by the International Parking and Mobility Institute. Provides revenue, occupancy, staffing, and operating cost benchmarks by facility type (surface, structured), market (urban, suburban), and ownership (private, public, institutional). The most comprehensive industry benchmark source for North American parking.
NPA (National Parking Association) data: NPA surveys provide supplemental benchmarking, particularly for membership-associated metrics.
Peer comparison programs: Some operators participate in informal peer benchmarking through management company networks or IPMI peer groups, where facilities with similar characteristics share operating data confidentially.
CBRE Parking Revenue Report: Published periodically, provides market-level parking revenue trends for major urban markets.
Dashboard Design and Reporting Cadence
An effective dashboard presents the right data at the right time to the right decision-maker:
Daily operational dashboard: Revenue, transaction count, occupancy peak, and equipment status. Consumed by facility manager and operations supervisor. Available by 8 a.m. for the previous day.
Weekly management report: Revenue by segment (weekly and cumulative month-to-date vs. budget and prior year), occupancy trends, staffing hours vs. budget, and week-over-week KPI changes. Consumed by district manager or general manager.
Monthly board/owner report: Complete financial statements, KPI performance vs. annual benchmark and budget, customer satisfaction scores, and notable operational developments. Consumed by property owner, senior management, or board.
Exception alerts: Automated alerts for real-time exceptions — equipment downtime, occupancy below/above threshold, revenue significantly below daily target — that prompt immediate response without waiting for the next report cycle.
Frequently Asked Questions
What is REVPOS and why is it a better metric than total revenue? Revenue per occupied stall (REVPOS) measures revenue efficiency — how much revenue is generated per stall of capacity actually used. It allows meaningful comparison between facilities of different sizes and corrects for occupancy differences when comparing periods. Total revenue grows with occupancy even if rate performance is declining; REVPOS captures rate quality independent of occupancy.
What occupancy rate signals that a facility is operating efficiently? Peak occupancy consistently in the 85 to 95 percent range indicates strong demand without systematic turning away customers. Consistently above 95 percent may signal unmet demand and a pricing opportunity; consistently below 80 percent suggests demand development opportunity or oversupply relative to the market served.
How should a parking operator benchmark their performance? Use IPMI’s annual Parking Benchmarks Report as the primary source for facility-type and market-type comparison. Segment by comparable facility types (surface vs. structured, urban vs. suburban) for meaningful peer comparison. Supplement with local market data from peer operators where available.
What is an acceptable equipment uptime rate for parking PARCS? 99 percent or better for primary entry/exit lane equipment. Below 95 percent indicates a reliability issue with equipment, maintenance practices, or vendor support that is creating unacceptable revenue and customer experience impact.
Takeaway
A well-designed parking KPI dashboard converts the continuous data stream from PARCS and financial systems into a clear, actionable picture of operational performance. The four-category framework — revenue, occupancy, operational efficiency, and customer experience — ensures that no dimension of performance is invisible to management. Benchmarking against IPMI data places individual facility performance in market context, and a reporting cadence that matches data granularity to decision-making frequency ensures that the right people have the right information at the right time.
Further Reading from Authoritative Sources
- IPMI Parking Benchmarks Report — annual revenue and occupancy peer comparison data — IPMI is directly cited as the primary source of parking KPI benchmarks in this article.
- ITE parking operations technical resources for performance measurement — ITE’s parking technical resources complement IPMI’s benchmarking data by providing the operational methodology and performance framework within which individual KPIs are evaluated and compared across facility types.